Kalshi’s esports markets traded $231.8 million across 4.05 million individual trades in June 2026, spread across 28 distinct series covering seven titles. With the danger of sounding like I’m flogging a dead horse, the $231.8 million traded does not equal total money risked, such is the nature of prediction markets.
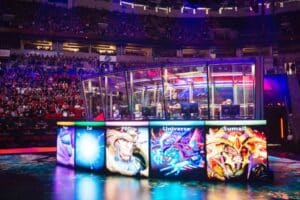
The more interesting one is this: 57% of it, $132.1 million, was a small cluster of Counter-Strike 2 markets, and a good chunk of that ran through one week in the middle of the month, when IEM Cologne was live. I previously broke down IEM Cologne’s Kalshi data here.
CS2 absolutely dominates June
There’s a clear market leader in what people are trading in June, and the answer’s clearly Counter-Strike. 59% of every esports contract traded on Kalshi in June 2026 was on Counter-Strike 2. This was almost entirely single-match betting (made up of game winner, map winner and total-maps markets), plus a small slice on the tournament-outright market.
No other title cracked 12% of the month’s volume, and the sheer dominance was particularly pronounced at IEM Cologne in the third week.
League of Legends Game Winner was a distant second at 11.6% of the month ($26.8 million), with Valorant’s game-winner market close behind at 8.7% ($20.1 million). Between them, CS2’s single-match betting, LoL’s game market and Valorant’s game market accounted for 77% of everything traded on Kalshi’s esports board in June. It goes to show that when there’s a major Counter-Strike event on, it swallows the competition. Whether or not that changes in July with LoL’s MSI taking place remains to be seen.
What “57%” is actually made of
It’s worth breaking such a substantial number down. CS2, broadly speaking, isn’t just one market on Kalshi. It can be split into five. These are whether a team wins the match; whether it wins a given map; whether the match goes over or under a total-maps line; whether a team qualifies for the next stage of a tournament; and, separately, who wins the whole event outright. Nearly four-fifths of CS2’s entire monthly volume, $103.8 million, sat in the single “who wins the match” market alone. Map winner markets added another 20% ($26.9 million).
The IEM Cologne effect, at a more granular level
The tournament comfortably produced pretty much all of the top ten biggest markets, and stealing a table I made for the IEM Cologne analysis, the match-level wagering generally followed the tournament progression.
Falcons were involved in the top three traded markets. This can simply be explained by the magnitude of the eventual winners’ contests with the two teams tipped to win it all pre-tournament in Team Spirit and Team Vitality.
League of Legends could be set for a big MSI
One match would break into the top ten, sitting just above 9z vs FURIA outside of Counter-Strike and that match was T1 vs Gen.G which saw $1.97 million traded. There’s not been an awful lot of League of Legends action of late with MSI play-ins just finishing up (and my god, did T1 look strong). The Korean World Champions didn’t drop a single map as they swept their way to the main stage at MSI. As we move into July, it’ll be interesting to see if having a huge global League of Legends event takes some of Counter-Strike’s thunder. Given that the number of fixtures is significantly lower, MSI may not reach Cologne’s total seismic volume,but I’d expect there to be some heavy-hitters on match volume alone.
Editor’s methodology note: Figures cover Kalshi esports markets from 2026-06-01 → 2026-06-30. “Contracts” refers to total contract volume traded on a market; “trades” refers to the number of individual fills. Weekly blocks run Sunday–Saturday from June 1; Week 5 is a two-day tail (June 29–30) and should not be compared directly to full seven-day weeks. CS2’s game winner, map winner, total-maps and qualifier markets are combined into one “Single-Match Betting” line throughout, since they’re all bets on the same underlying matches; the separate CS2 Tournament Winner market (an outright futures pick) is kept on its own line. Individual-match figures combine both sides of a match (e.g. “will A win” and “will B win”) into one market-size total; where only one side’s volume was available, the figure is flagged and reflects that side alone. Figures are sourced from Kalshi’s public market data.